

Oil Companies: Income Tax Expense (2020-2024)
Income Tax Expense Bar Chart Income Tax Expense Comparison (2020-2024) Note: Total Oil Companies Tax Expense was US$5,230,524,082.00 whereas Guyana’s total income was US$6,275,194,950.97
Guyana Oil Income vs Companies Profit Guyana Oil Income vs Oil Companies Profit (2020-2024) Total Guyana Income $6.28B 2020-2024 Total Companies Profit $29.00B 2020-2024 Profit to Revenue Ratio 4.6:1 Average 2020-2024 Key Insights: Both Guyana’s oil income and companies’ profit have grown significantly from 2020-2024 Oil companies’ profit consistently exceeds Guyana’s income by a factor…
Pie Chart 2024 Stabroek Block: Guyana’s missing US$4.2 billion profit share US$2.6b received US$4.2b missing Guyana Actual Take: US$2.6 billion (14.6%) Guyana’s Profit US$2.2b and Royalty US$0.4b Guyana’s Missing Profit: US$4.2 billion (23.6%) Remaining Revenues: 11.0 billion (61.8%) Total 2024 Revenues: US$17.8b & Pre-tax profit: US$12.9b
Pie Chart 2024 Stabroek Block: 50/50 Pre-tax Profit Share? US$2.2 billion (17.1%) US$10.7 billion (82.9%) Guyana: US$2.2 billion (17.1%) EMGL/HESS/CNOOC: US$10.7 billion (82.9%) Total Stabroek Block Pre-tax Profits: US$12.9 billion Pie Chart 2024 Stabroek Block: 50/50 After-tax Profit Share? US$2.2 billion (21.2%) US$8.2 billion (78.8%) Guyana: US$2.2 billion (21.2%) EMGL/HESS/CNOOC: US$8.2 billion (78.8%) Total Stabroek…
It is sickening to look and listen to a daily diet of the PPP/C’s blatant falsehoods suggesting that the terms in the lop-sided Oil Contracts were created by the APNU/AFC Coalition – a lie perpetrated to cover-up the PPP/C’s spinelessness in not seeking Contract renegotiations to make a better deal with Exxon for a fair…
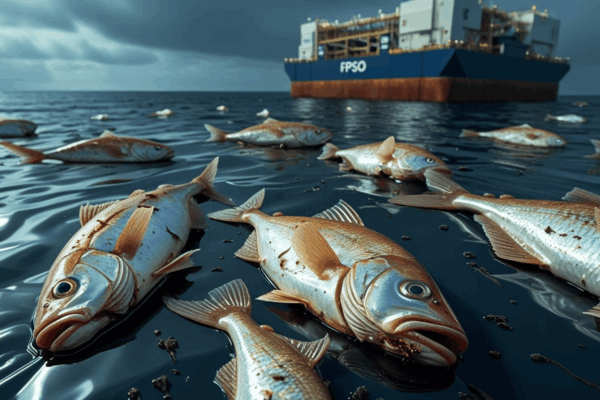
Dear Editor, The Oil and Gas Governance Network (OGGN) here amplifies Ms Danuta Radzik’s letter in Stabroek News on 30 May ‘Reported 77% reduction in fish exports and reduction on catches can be attributed to the tonnes of toxic waste discharged into the ocean’. We take up numbered paragraph 8 in Ms Radzik’s letter, on…
Hess Guyana – Statement of Changes in Equity Hess Guyana Exploration Limited — Guyana Branch Statement of Changes in Equity from 2018 to 2024 Stacked area chart showing Capital Contributions and Accumulated Profit/(Deficit) evolution (2018-2024) HESS Capital Accumulation 2018 to 2024 Accumulated Profit/(Deficit) Key Observations & Strategic Insights 2018-2020: Initial deficit period with accumulated losses…
Statement of Changes in Equity – Stacked Area Chart EMGL Statement of Changes in Equity from 2018 to 2024 Stacked area chart showing Capital Contribution and Accumulated Profits (2018-2024) EMGL Cumulative Capital Contribution: : 2018 to 2024 EMGL Accumulated Profits: 2018 to 2024 Key Observations: 2018-2020: Accumulated profits were negative (accumulated losses) 2021: Turning point…
CNOOC Petroleum Guyana – Profit/Deficit Analysis 2019-2024 CNOOC Petroleum Guyana Limited (GYD) Profit/Deficit Financial Analysis (2019-2024) Annual Profit/Deficit Trend (Billions GYD) Cumulative Performance Overview 📈 Key Performance Highlights Dramatic turnaround: From -20.9B deficit (2019) to 1.07T profit (2024) Break-even achieved: In 2021 with 49.5B GYD profit Exponential growth: 2,070% increase from 2021-2024 Consistent profitability: 4…
Statement of Changes – Stacked Area Chart CNOOC changes in Deficit & Profit from 2018 to 2023 ($US using 208.5 conversion) Full Period Turnaround Era Growth Phase Deficit Periods Profit Accumulation Annual Net Income